
How to measure the success of your online business – 10 metrics to track
What distinguishes successful retailers from others?
One of the main mistakes which marketers are making is to believe that creating an online business ends with building their online store.
The strength of e-commerce is that consumers leave so much information when they browse which could be measured, and based on that, we can find errors or elements for improvement. In this article, you will find 10 metrics to measure the success of your online business. Let’s not waste more time and go on.
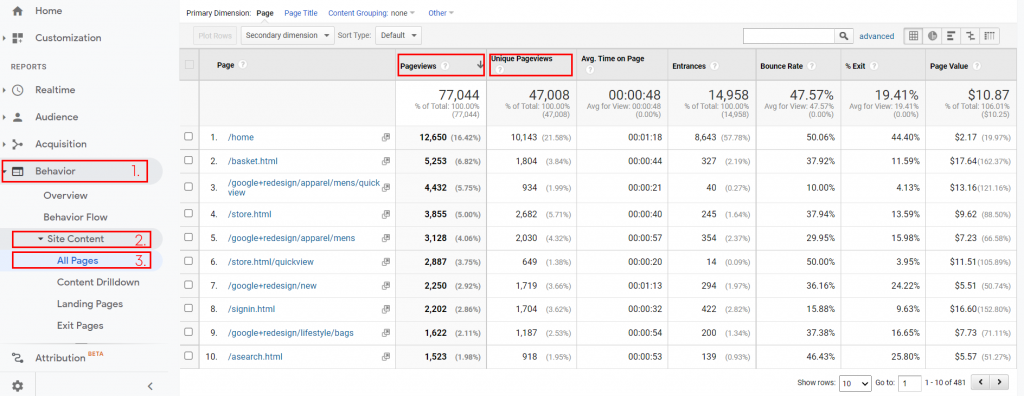
Pageviews & Unique pageviews
This is the first and most important metric, which is very underestimated. It shows the traffic to specific pages of the site. If the number of orders decreases, look if it is due to a low number of visitors. If so, take a deeper look at the reason for their decline.
To find out how many page views have a particular page, go to the section Behavior > Site Content > All pages. In the “Page” column, you will find all URLs of your pages, and in the next column (Pageviews), you will find the number of visitors of each page. The number of page views also includes reopening them during the site visit. But where can you see how unique her visits are? In the next column – Unique Pageviews.
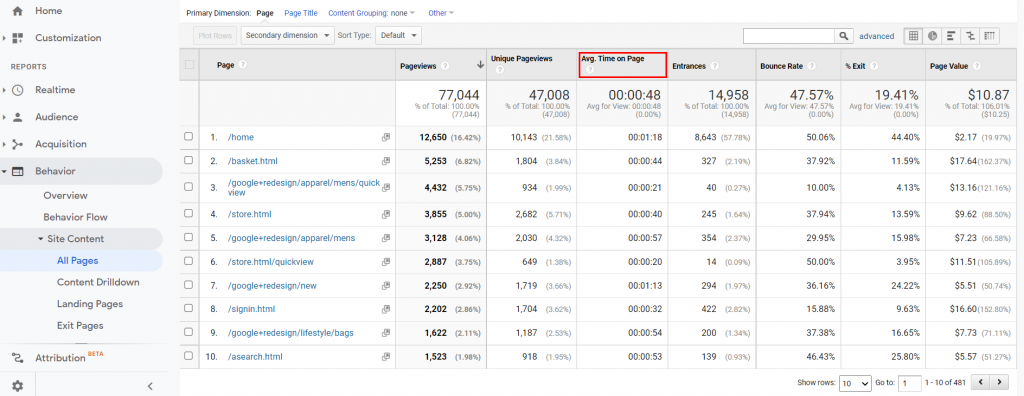
Average time on page
If specific pages have low average time users spend on them, consider whether this is due to a bad design or technical problem.
This indicator can be found in the same report (Pageviews & Unique Pageviews), in the column Average Time on Page.
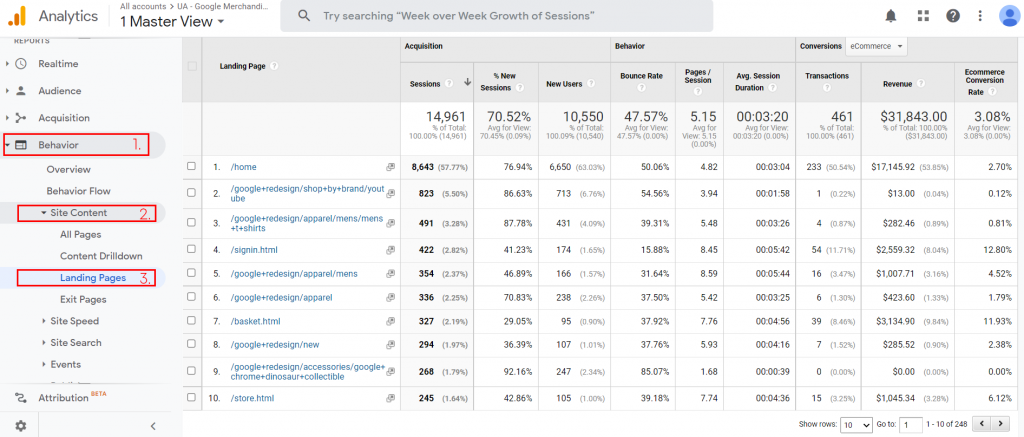
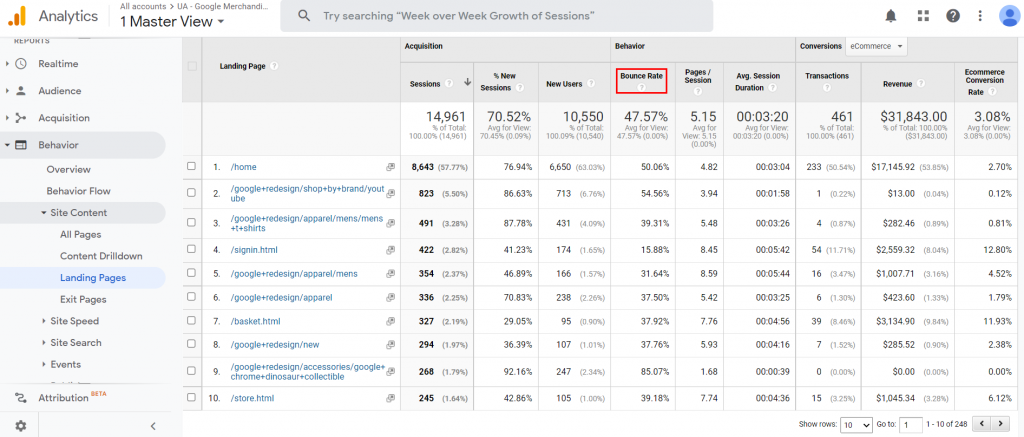
The report contains information about the page(s) users land on when they open your site. In this report, you can see how many new users have come to a page, and that’s how you can measure the success of specific campaigns, posts, etc. You will find it in Behavior > Site Content > Landing pages.
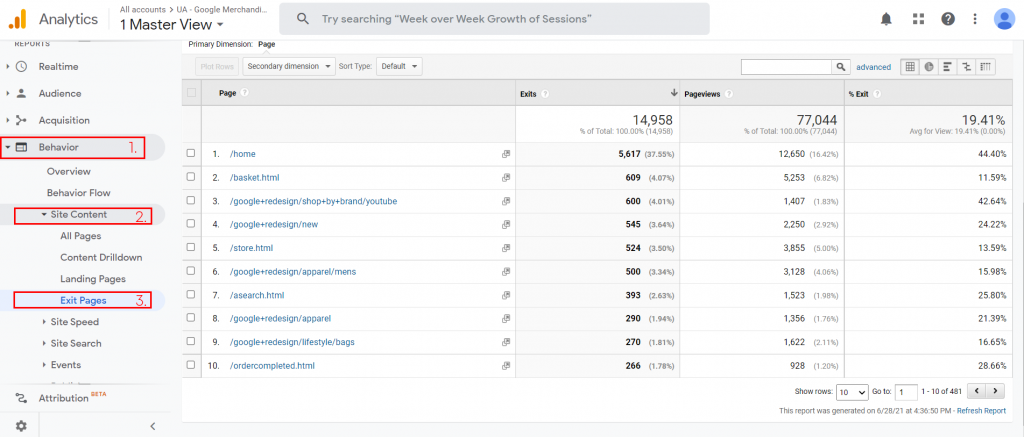
Exit pages
Exit pages are pages on which users close your site. That is an essential metric because here, you can find the weaknesses of your site. Many users leave before making an order due to difficulty. Seeing where consumers leave our online store, we could discover how to improve it, which will increase your site’s efficiency.
You can find the report in Behavior > Site Content > Exit pages.
Source/Medium
Through most of our marketing activities, we aim to lead more and more users to our website. But how do we track where our users come from? Here comes the aid of one of the most used marketing reports – the Source / Media report. To access it, open the menu Behavior > Site Content > Landing Pages.
Once you’ve opened the report with the pages that users come across when they open your site, select the URL of the page you’re analysing and go further into the report. Then, in the “Secondary dimension” option, look for “Source / Medium” and select it.
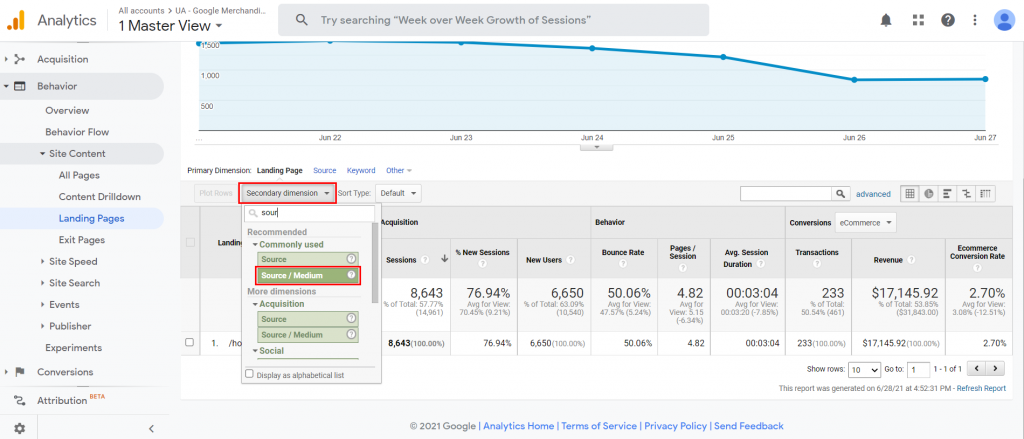
To the right of column “Landing pages” will open a new column named “Source/Medium” where you will see the source of the traffic to this page, as well as the medium.
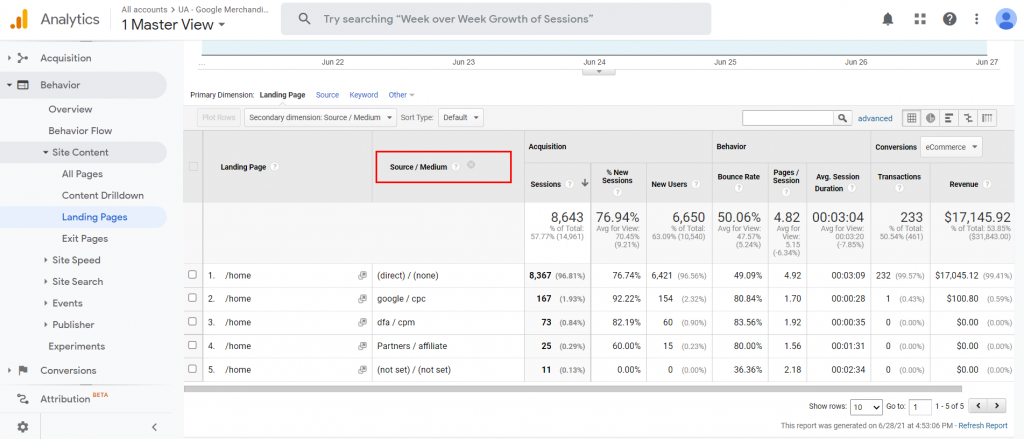
The sources represent the places where the user came from to the site – direct traffic, social networks, search engines, etc., while the medium shows the type of content from which the user came – paid traffic, organic traffic, post, etc.
Bounce rate
The next metric we will look at is the bounce rate. It represents the percentage of users who leave the site without interacting with it. With this metric, you can rediscover weaknesses on the site and improve them. You can find it as a column in almost every report.
Important: 100% bounce rate is not always a cause for concern. It is fully eligible for the Thank-you page, which is the last page users see after completing an order. Upon reaching it, it is quite natural for the user to leave the site. Then that page will have a 100% bounce rate.
Conversions
Conversions (or goals) are the most important actions we want users to do – order, subscribe to the newsletter, download an application, add a product to the cart, etc. We can create each of these actions as a goal in Google Analytics and set them up on our advertising channels such as Facebook and Google Ads. That is the best indicator of the success of our business, and it shows the effectiveness of the actions we take.
CPA
Cost-per-acquisition is the price we pay to complete a conversion. For example, if we have an active ad in Google Ads, which in a given day spent 50 euros, and made 10 orders, the price for one order amounts to 5 euros. This cost must be well weighed against how much we earn on average from each completed conversion so that it doesn’t turn out that the cost we pay for selling is more than we can afford.
ROI
Return on Investment – an indicator often missed for measurement by retailers, which shows the income based on the costs we have made for our business. The costs can include advertising, affiliate campaigns, costs for improvement and maintenance of the online store, etc.
ROAS
Return on Ad Spend is a fundamental indicator that shows the effectiveness of advertising. It is measured in percentages and shows the revenue we generate for 1 euro spent on advertising, and it is good to be measured regularly.